Think big!
How much data will the biggest and longest expedition to the Arctic produce?
Written by Atmospheric Scientist, Amelie Kirchgaessner

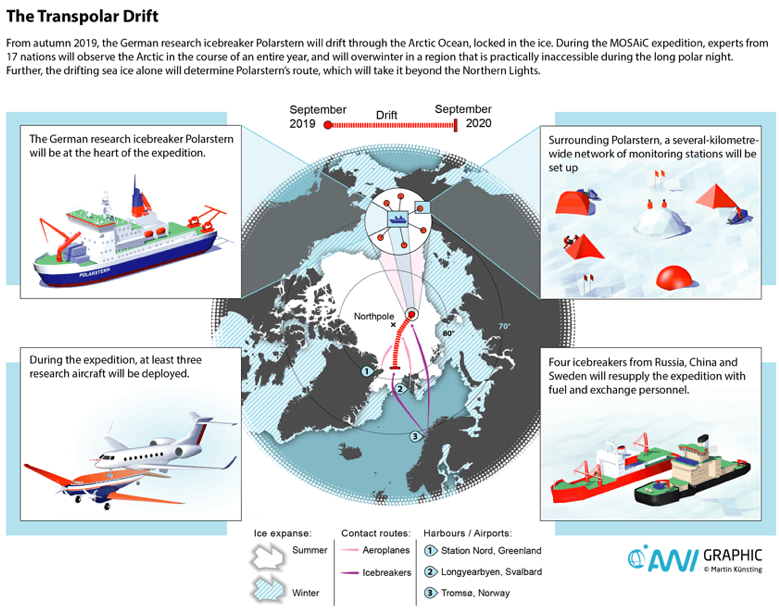
In September 2019 the German research icebreaker Polarstern will depart from Tromsø, Norway, for the international project MOSAiC (Multidisciplinary drifting Observatory for the Study of Arctic Climate). Once it has reached its destination in the sea ice, it will spend the next year drifting through the Arctic Ocean, trapped in the ice. A total of 600 people from 17 countries, who will be supplied by other icebreakers and aircraft, will participate in the expedition – and several times that number of researchers will subsequently use the data gathered to take climate and ecosystem research to the next level. I am one of the ones lucky enough to be involved in this endeavour through a NERC funded project “Sea Salt Aerosol Above Arctic Sea Ice – sources, processes & climate impact” (SSAASI-CLIM).
So, a little bit of background to give you an idea of the overall scale. The year-long measurements of atmosphere, ocean, sea-ice, biogeochemistry and ecosystem are organised through eight topical working groups. The pure scale and logistical complexity of the expedition, the multitude of observations, and the sheer number of participating scientists and institutions make good data management vital for the short term and long-term success of the endeavour. Just imagine that three years down the line I may want data from another group and find it has been accidentally deleted as not relevant, is in a format that is impossible to read, is incompletely documented, or no one really knows where it is, and the person who collected it, has moved on in the meantime.
My training with Data Tree not only was a good general reminder of this, but more importantly made me aware of all the details that we will need to consider.
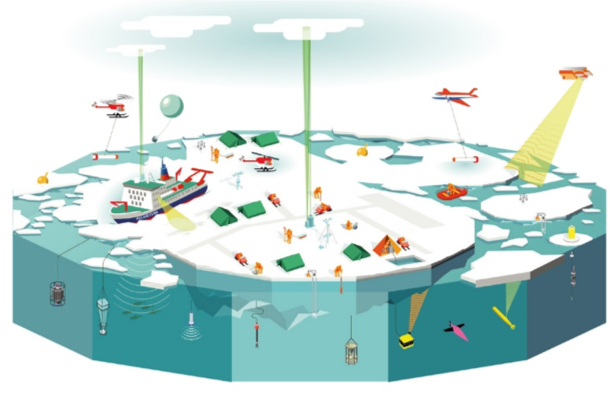
The centrepiece of the expedition will be the ship-based ice camp with comprehensive instrumentation to thoroughly observe processes within the atmosphere, ice, and ocean. This central, intensive observatory will be embedded within a constellation of distributed measurements made by buoys, ice-tethered profilers, remote stations, underwater drifters, unmanned aerial systems, aircraft, additional ships, and satellites.

Produced by AWI Graphic
For our SSAASI-CLIM’s little part of the
bigger whole, we will have three groups of measurements. We will have
instruments installed on the crow’s nest of the ship, measuring continuously
over the entire 12 months. We will have a specially modified shipping container
on the deck that we have turned into a lab for the analysis of air samples,
which are drawn from outside to pass through various filter systems and
instruments in the container. The third group will be episodic measurements,
when conditions are interesting and permitting. These are measurements by
heli-kite, a helium-aided kite that allows profiled measurements up to 1000m
above the surface. We will attach instruments to the heli-kite that capture
chemical and physical properties along this profile. Further episodic
measurements will be done with a Spectrometer for Ice Nuclei, an instrument
that cannot run for more than a few hours at a time and needs a lot of looking
after when in operation.

Three examples: One of the optical particle detectors in the lab has so far only been used on a research aircraft for a maximum of five and a half hours. Fortunately, output is only a short string of numbers, so extrapolated to 365 days, it will only use up 3 Gigabyte of data space.
Among other things on the crow’s nest, we will install a Cloud and Aerosol Precipitation Spectrometer (CAPS). This is another instrument that is designed for - and so far, has only been used on - research aircraft. Now the intention is for it to measure continuously over one year. CAPS takes images of cloud droplets or crystals as they fall through the detector. This means that the data requirements are dependent on the conditions it samples. The more precipitation or fog it encounters, the more images it takes, the more storage it will require. Basis for a best estimate was therefore an episode during one flight which had particularly large sections of “in-cloud” measurements. The “worst case scenario” in terms of data storage requirements in this case would be a year of continuous fog and precipitation. That may be unlikely, but extrapolated to one year, this adds up to 1 Terabyte.
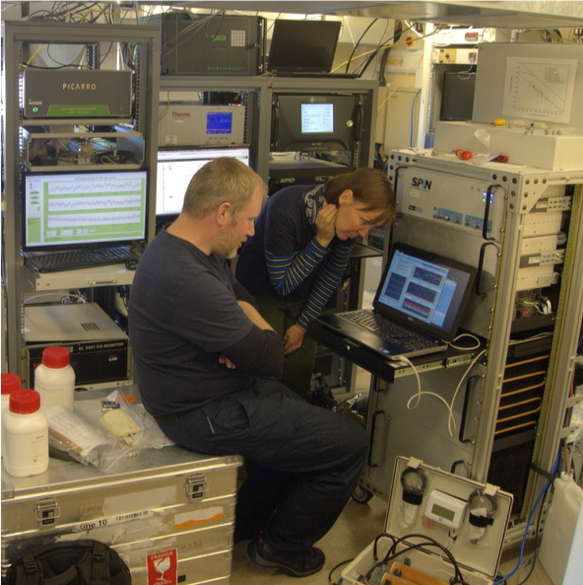
Next, the Spectral Ice Nuclei Counter (SPIN): I assume that it will be operated once a day for no more than a quarter of the time, not least because it needs a specially trained operator and cannot be relied to run independently “quietly in the background”. On this basis, looking at files from previous campaigns, SPIN will produce 200 gigabytes over the duration of the campaign.
These are only three of the fourteen instruments that just SSAASI-CLIM will have either in the container lab, on the crow’s nest, or on the sea ice. Fortunately, my colleague Markus Frey will get the figures for the other eleven. I don’t want to even start to think about the couple of hundred other scientists and their kit, different operating systems, file formats, backup schedules, and so on.
Next, I will have to calculate the total energy consumption of our instruments, pumps, laptops etc., and measure their noise level...
Read the press release about this expedition on NERC's website